Meek STV Explainer
Table of Contents
I’ve recently spent some time thinking about Meek STV – see in particular this auditing pre-print I recently put on the arxiv! – and since this election method is less well-known I thought I’d write a brief explainer. I’m going to assume you’re very familiar with traditional (a.k.a. “Weighted Inclusive Gregory Method” or WIGM) STV for this post – or you can go here for my take on explaining WIGM.
The High-Level Picture.
Here’s the super-short summary of what Meek does differently than WIGM STV:
- Instead of transfer values, Meek uses keep factors. If Meek did nothing else differently, you could just think of these as the complement of transfer values: whereas a transfer value is $\tau = (T-q)/T$, a keep factor is $k = q/T = 1-\tau$.
- Meek allows winners to receive transfers even after they are elected. When this happens, the transfer puts them above quota again, so they lower their keep factor, meaning they transfer more votes to their down-ballot candidates.
- It also re-calculate quota every round, using the weight of active votes rather than the total number of votes cast in round 1 for this computation. In a 3-seat contest, if round 1 had 450 votes cast, but 50 of those votes were exhausted by round 2, then we re-calculate quota as $400/(3+1)+\varepsilon\approx 100$ in round 2.
- To calculate quota, it uses a slightly unusual version of Droop quota: $q = N’/(m+1) + \varepsilon$, where $N’$ is the number of active votes in the election, and $\varepsilon$ is usually set to $10^{-6}$. Because we don’t floor, and $\varepsilon$ is a fraction, this quota is not usually an integer.
The way I would describe the impact of those changes is that Meek is the variant of STV that is most kind to winners. When a winner gets elected, they are encouraged to “squeeze’’ as much ballot weight out of their tally and to their down-ballot candidates as possible. They have as much say in the election as possible, and the timing of their election matters less. They don’t waste any ballots if quota gets lowered in a future rounds, or if a future elimination would transfer more ballots that would otherwise exhaust into their coalition.
We can talk about the normative merits or demerits of this system later – but from an algorithmic point of view, the most attractive quality of this system compared to WIGM is that keep factor calculation is now chronology-agnostic. To calculate the keep factor of a candidate, it is no longer necesary to know which candidates were still in the running when they first got quota. Instead, every candidate’s keep factor is initialized as 1 in every round, and iteratively lowered until their tally is within a tolerance $\omega = 10^{-6}$ of the current value of quota. Here’s some pseudo-code to illustrate this process:
num_cands <- M
num_seats <- m

# initialize keep factors as 1
for i in range(M):
    k[i] <- 1

# initialize quota using starting total ballot weight
quota <- len(ballots)/(m+1) + 1e-6

# calibrate keep factors until all tallies are no more than 1e-6 above quota
while True:
    # initialize tallies at 0
    for i in range(M):
        tallies[i] <- 0
    for bal in ballots:
        current_bal_weight <- 1
        for ranked_cand in bal:
            tallies[ranked_cand] += k[ranked_cand]*current_bal_weight
            current_bal_weight *= (1 - k[ranked_cand])
    quota = sum(tallies)/(m+1) + 1e-6
    # check if all tallies are within tolerance of quota
    if all(tallies - quota < 1e-6):
        break
    # otherwise adjust the keep factors and repeat this process
    for i in range(M):
        k[i] *= min(quota/tallies[i], 1)

winners = where(k < 1)
loser = argmin(tallies)

# eliminate the loser from all the ballots, and repeat this process for next round
Some Basic Examples.
Let’s start by illustrating the fact that winners can receive transfers after the round of their election, by looking at the following profile, where we are filling $m=2$ seats:
| Full Ranking on Ballot | (A,B) | (B) | (C) | (D, A, C) |
|---|---|---|---|---|
| Number of times cast | 101 | 80 | 90 | 29 |
The number of votes cast in this election is $N=300$, so initial quota is $q = 300/(2+1)+\varepsilon\approx 100$. Since no votes ever exhaust from this election, this will be the value of quota for the whole election.
We see that candidate A has initial quota. In WIGM STV, her transfer value would be calculated as $\tau = 1/100$, so she would transfer exactly one vote to candidate B, the other member of her coalition. In the next round, candidate D would be eliminated, and all 29 of D’s votes would skip over candidate A and transfer straight to candidate C, meaning C is elected in the last round with a quota of votes.
In Meek, when D is eliminated, her 29 votes still transfer to A, who now has 130 votes in her pile. She re-calibrates her keep factor to $k = 100/130\approx .76$. This new keep factor is applied to all votes in A’s pile: this means she transfers $101\cdot .76\approx 23.3$ votes to B, and $29\cdot .76\approx 6.7$ votes to C. This pushes B above C, and above quota, in the last round of the election.
Now, let’s look at an example that illustrates the changing value of quota. Here’s another profile to fill $m=2$ seats:
| Full Ranking on Ballot | (A,C) | (B) | (C) | (D) | (E) | (F) |
|---|---|---|---|---|---|---|
| Number of times cast | 120 | 100 | 79 | 60 | 50 | 41 |
This election initially has $N=450$ ballots, so initial quota is $q_1 = 450/(2+1)+\varepsilon \approx 150$. No candidate has initial quota, so we eliminate candidate F in round 1.
This exhausts $41$ votes from the election, so the new number of active votes is $N’=409$, and new quota is $q_2 = 409/3+\varepsilon \approx 136.33$. Still, nobody has quota, so we eliminate candidate E in round 2.
This removes a further 50 votes from the election, so our new $N’=359$, and new quota is $q_3\approx 119.66$. This time, candidate A has quota – despite having never received a single vote transfer – so she is elected and passes $.33$ of a vote to candidate $C$.
In the following round, we eliminate candidate $D$, making $N’ = 299$, so $q_4\approx 99.67$. Two things then happen:
- Candidate A would further lower her keep factor, because she finds herself in surplus of quota. She transfers a further 20 votes to candidate C, who now has a total tally of $99.33$ votes.
- Despite this, candidate B still has more votes than candidate D, and also makes quota, with her tally of $100$ votes being $.33$ of a vote in surplus of a quota.
So in this election, both winners make quota despite never having received a single vote transfer.
Some Advanced Examples.
In all the examples we looked at so far, we just had to calibrate keep factors once each round – after this initial calibration, no new votes exhausted, so the winners did not find themselves in excess of quota again. But this is not usually the case! In the last example, you can imagine how if candidate A had not transferred her surplus votes to C, the votes exhausted from her winning tally would have caused quota to lower again, and A would have had to further adjust her keep factor, repeating this process until her surplus is less than some tolerance $\omega=10^{-6}$.
Here’s an example of this iterative process to calibrate keep factors, with another profile to fill $m=2$ seats:
| Full Ranking on Ballot | (A,B) | (A) | (B) | (C) |
|---|---|---|---|---|
| Number of times cast | 60 | 90 | 63 | 87 |
It helps to think of candidates A and B as being part of a (non-solid) coalition in this profile: candidate A was a popular front-runner, and some 40% of A voters also like candidate B, although most were indifferent.
In this profile there are $N=300$ voters, so initial quota is $q_1\approx 100$. Candidate A starts out with a tally of $150$ votes, so her keep factor is initially $k_1=100/150\approx .66$.
After applying this keep factor, candidate A transfers $60\cdot(1/3)= 20$ votes to B, and a further $90\cdot(1/3)=30$ votes exhaust from her pile, because they listed no further preferences. But this means the number of active votes has gone down! We now have $N’=270$ active votes, so the new value of quota is $q_2=90$, and candidate A’s calibrated tally of 100 votes is in excess of quota again.
To fix this, candidate A adjusts her keep factor again. She multiplies her previous keep factor $k_1$ by the factor that would calibrate her new tally at $q_2$ – namely she computes $k_2 = k_1\cdot (90/100)=18/30$, and then she transfers her whole pile of ballots from scratch, using $k_2$ instead of $k_1$.
This time, she transfers $60\cdot(12/30)= 24$ votes to B, and she exhausts $90\cdot(12/30)=36$ votes. Of course, this means $N’$ has just further decreased by $6$ again – so we iteratively repeat this calibration until A’s tally is within tolerance of quota. Here’s an illustration of the first four of these calibration steps:
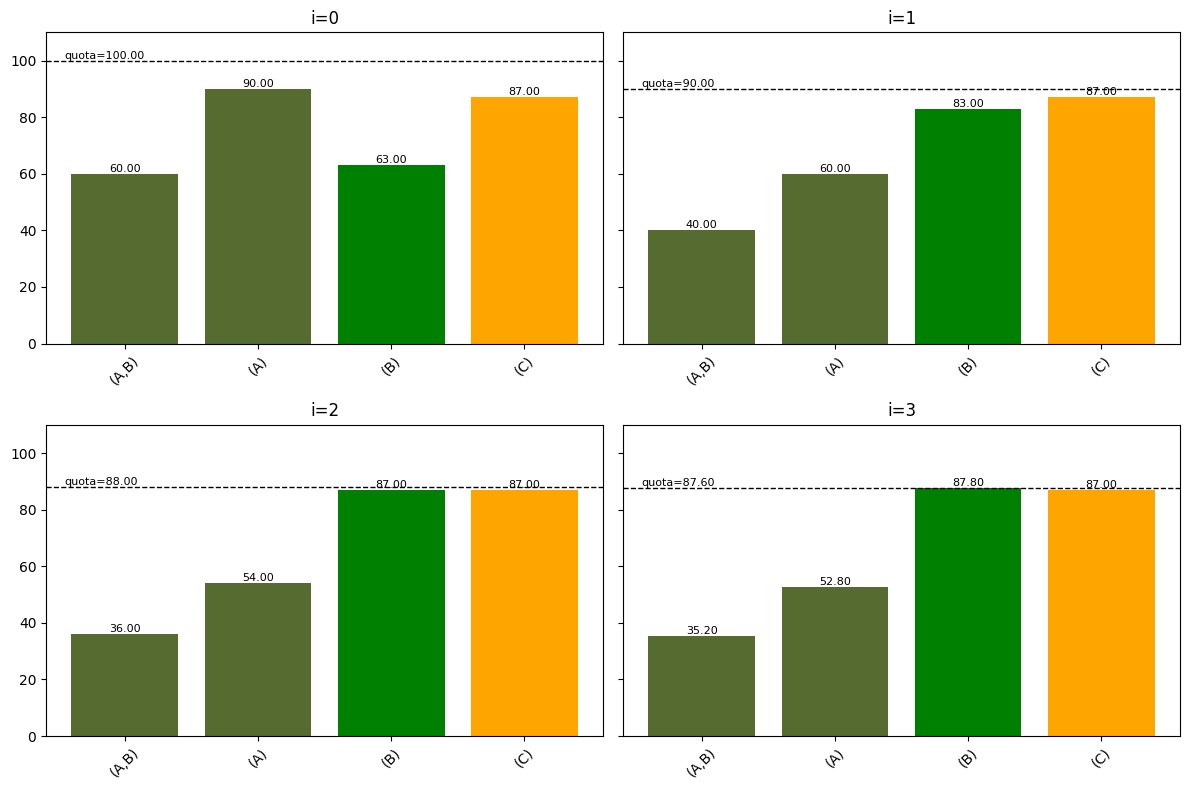
In this example, it takes three iterations of keep factors for candidate B to beat candidate C and achieve quota, and the calibration process stop after $i=12$ steps, when candidate A finally sees her tally stabilize within tolerance of quota. By contrast, WIGM STV would stop this calibration process at stage $i=1$, when candidate B’s tally of 83 votes was still losing to candidate D’s tally of 86 – so WIGM would elect C, whereas Meek elects B.
By the way, this iterative keep factor calibration is a fixed point algorithm. If candidate A had the foresight to consider how the votes she exhausts would affect quota, she could setup an equation to “instantly calibrate” her keep factors at quota:
\[ \frac{300-90\cdot(1-k)}{3}+\varepsilon = 150k. \]This equation has solution $k=7/12+\varepsilon/70$, which is the value that candidate A’s sequence of keep factors converges to.
The other pattern that leads to an iterative keep factor calibration process in Meek is when there are two elected winners transfer votes back and forth to each other. Consider the following profile for $m=3$ seats:
| Full Ranking on Ballot | (A,B,C) | (A,C) | (B,A,C) | (B,C) | (C) | (D) |
|---|---|---|---|---|---|---|
| Number of times cast | 90 | 30 | 90 | 30 | 61 | 99 |
Here we have $N= 400$ votes, so quota is $q\approx 100$, and no ballots ever exhaust, so this value of quota stays fixed throughout the election.
Initially both candidates A and B have a tally of $120$ votes, so they set their keep factor $k_A=k_B = k_1 = 100/120=5/6$. Let’s look at how this affects candidate A’s tallies:
- Of the $90$ ballots (A,B,C), candidate A keeps $75$, and passes on $15$ to B.
- Of the $30$ ballots (A,C) , candidate A keeps $25$, and passes on $5$ to C.
- Then, candidate A receives $15$ votes from candidate B’s (B,A,C) pile. Importantly, candidate A also applies her keep factor to these votes; she only keeps $15\cdot(5/6)=12.5$ of them, and passes the remaining $2.5$ votes on to candidate C.
At the end of this process, candidate A has $75+25+12.5 = 112.5$ votes, and so does candidate B, putting them both 12.5 votes in excess of quota. This means they compute new keep factors $k_2 = k_1\cdot (100/112.5)$, and re-start the transfer process from scratch, iterating until their tallies get within $10^{-6}$ of $q=100$. Meanwhile, candidate C progressively receives more votes from both A and B – below are the first six calibration steps.
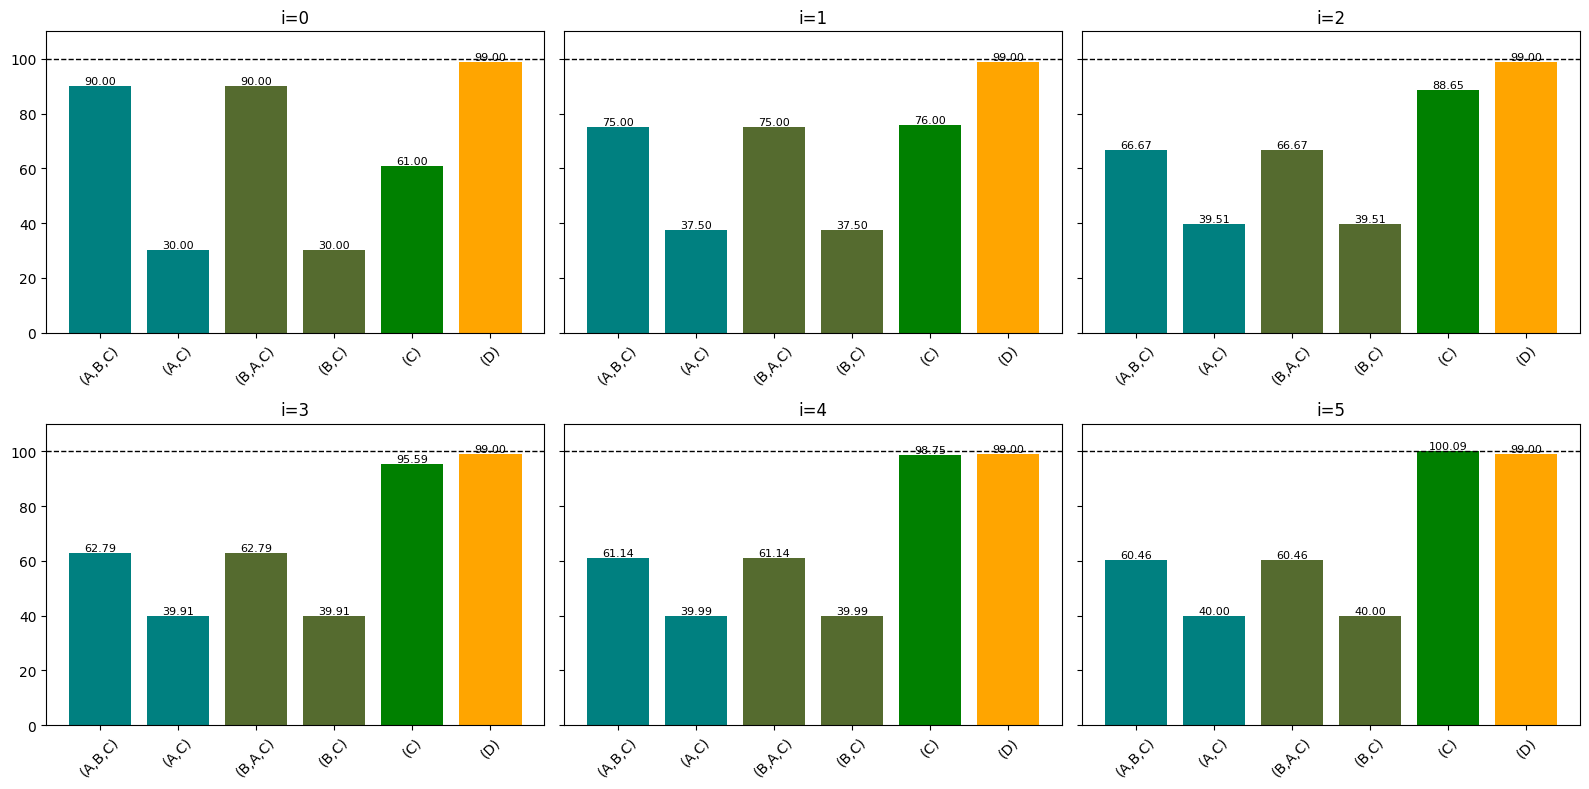
In this case, it takes $i=5$ sets of keep factors for candidate C to beat candidate D, and it takes $i=20$ iterations for A and B to calibrate their tallies at quota. By contrast, WIGM STV would stop callibrating a step $i=1$, so that WIGM would see D be the third elected candidate, whereas Meek elects candidate C.
Yet again, we could solve for the convergent keep factor instantly by setting up the right system of equations – here, the symmetry of the problem collapses them to
\[ 100+\varepsilon = k(120 + (1-k)90), \;\text{or}\; 0 = 90k^2 - 210k+100+\varepsilon. \]This polynomial has a single root $k\approx 2/3$ in the interval $[0,1]$, which is the convergent value of our keep factors.
For an in-depth case study of a (real-world) WIGM STV election where Meek would have produced a different result than WIGM, have a look at Section 1.1 of my arxiv paper .
What This Means for Auditing.
The normative value of Meek is ambiguous to me – on the one hand, Meek does make some common STV voting strategies less viable (such as ‘parking your vote’), and it makes it so that candidate strength correlates more reliably with election outcome. On the other hand, Meek is more favorable to coalitions of candidates than WIGM, and it makes the burden of voter education even heavier than WIGM already does. Especially when you consider that the majority of Ranked Choice Voting elections have the same outcome under Meek as they do under WIGM, that last point feels like it weighs heavily against the former – it’s hard enough to convince people that WIGM is worth their time.
I would say that Meek is maybe ‘deceptively elegant’ – a lot of the more complex algorithmic subtleties of Meek are more flair than utility. That being said, what first brought my attention to Meek was the comparative advantages it had against WIGM when it comes to auditing specifically.
The Good.
In traditional STV, uncertainty about which round a candidate gets elected in can result in large confidence intervals for their transfer values, which irreversibly percolates into the rest of the election. Consider this example for $m=2$ seats:
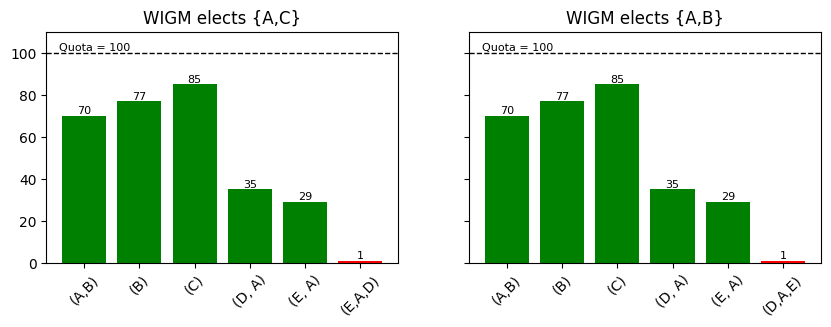
The only difference between these profiles is one vote, which changes its mind about which of candidates D or E it wants to rank above candidate A. In both profiles, candidate E is eliminated first, but in the first profile this gives exact quota to candidate A, who is then elected with a transfer value of $\tau = 0$. In the second profile, candidate D is eliminated and gets to transfer her votes to A, electing her with a surplus of $35$ votes, and a transfer value $\tau = 35/135\approx .26$.
This means that when we audit this election, our best confidence intervals for $\tau$ will contain $(0,.26)$, because a difference of $1$ vote can get us from one endpoint of that interval to the other. This makes the election unauditable, because at the low end of this interval the winner set is {A,C}, and at the high end of the interval the winner set is {A,B}.
This is no longer a problem with Meek! In both profiles, the second Meek winner is B, because even in the first profile, when D is eliminated after A has already reached quota, D’s votes still transfer to A, who adjusts her keep value initially at $k = 100/135$. This keep value then gets iteratively lowered, because some of candidate A’s votes exhaust, but in any case over $(70\cdot 35)/135 = 18.14$ votes transfer from A’s pile to B, putting them a margin of $10$ votes above C – a lot easier to audit than our previous margin of $1$ vote.
The Bad.
Meek STV is computationally inconvenient to audit for two reasons:
- The dynamic recalculation of quota each round introduces more variables into margin to audit; and
- The iterative process used to calibrate keep factors is mathematically complex and fragile.
That first point is less important than the second – the margins in Meek already depend on many variables, and adjusting quota is not the worst part of that. In the worst case, we could just use a modified version of Meek that doesn’t re-calculate quota every round.
The second point is the more challenging one. For auditing, we need to use the exact solutions to the keep factor equations. As we saw in our $3$-seat example, these exact keep factors are the solution of an $n^{th}$ degree polynomial, where $n$ is the number of seated winners who need keep factors. These polynomials can be turbulent – there exist election profiles where changing a single vote can wildly impact their solutions – and this in turn makes auditing more difficult.
The Ugly.
Meek only changes how STV behaves after the first transfer happens, and some of the difficulty for auditing STV comes from the early, chaotic rounds of the election, where fickle elimination orders can remove promising candidates from the race. Here’s an illustration of this happening in an IRV race:
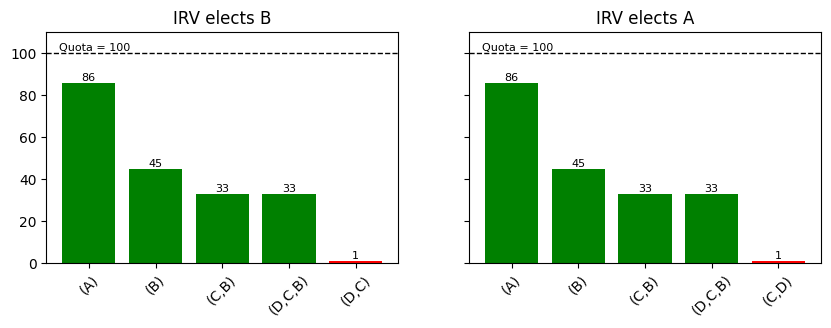
Yet again, a difference of one vote (which did not even rank either of the two competitive candidates) can change the outcome of the election; and this is true even before we seat a single winner, whether we use Meek or WIGM rules to transfer surpluses. This backs the conventional wisdom that algorithmic election methods are harder to audit because more rounds means more opportunities for razor sharp margins.
That being said, real world elections rarely have these kinds of dynamics, where strong candidates are at risk of elimination in the early rounds. Usually, strong candidates start strong, and stay so throughout. In such a situation, Meek STV does have an advantage on WIGM when it comes to auditability – there are some situations where uncertain transfer values are a problem for WIGM, whereas they are not for Meek. Usually, the only close margin in a Meek election is the one between the last seated winner and their strongest opponent.
The Bottom Line.
Meek STV is nice because it is less chronology-dependent than WIGM, but its higher computational complexity is a problem.
There are ways of trading off these two facts against each other – we could conceive of a hybrid election method which combines the best of both worlds. A realistic way to do this might be to re-compute keep factors in each round, as Meek does, but stop after a single iteration of the process. To account for situations where later winners only make quota because of transfers from earlier winners, such a hybrid election method would still have to calibrate each keep factor one after the other – but this is still less chronologically fragile than WIGM STV, because we only need to remember the order winners were seated in, as opposed to the full set of hopeful candidates still running in the round they were seated.
How to Report Meek Elections.
Currently, Meek STV is only used for political elections in some City Councils in New Zealand (that I know of). Some versions of Meek STV have also been used for online elections in some open-source projects. In trying to re-create the round-by-round tabulation for some of these online elections, it became clear to me that we need very clear standards to report their outcomes, if we value election security and reproducibility.
In particular, there are two common practices that I would argue are detrimental to outcome reporting:
- It is currently common practice to break out of keep factor calibration the moment a new candidate sees their tally surpass quota. This is of no mathematical importance as long as the tabulation was correct, but it does obscure reporting by making it look like some winners’ tallies were not adjusted at quota when a decision was made to seat the next winner.
- It is also common practice to start calibrating a new round’s set of keep factors where the previous round left them off; that is, instead of initializing all keep factors at 1, the tabulator will initialize the keep factors of winners as the keep factor they converged to in the previous round. This too has no mathematical importance – keep factors are monotone decreasing with rounds – but again, it can obscure reporting and compound rounding innacuracies from round to round.
New Zealand actually does a relatively good job when it comes to communication of outcomes – you can see one of their election reports here – but they do not post anonymized CVRs anywhere, and their final tallies in every round are not calibrated at quota. That being said, the reports they do publish do a good job of communicating the final keep factors of every candidate in every round, which is a useful indicator of their relative strength compared to the other winners.
If it were entirely up to me, governments would adapt the following standards to report their tabulations of Meek STV elections:
- always start calibrating keep factors at 1, in every round – do not seed the keep factors with their previous round’s values.
- only ever break out of keep factor calibration when every winner tally has converged to be within tolerance of quota.
- declare a rounding precision at the start of the election (either $10^{-6}$ or $10^{-9}$) and use it to round every tally, keep factor, and quota in every iteration of keep factor calculation.
- in the extended tabulation report of the election, publish, for every round in the election, and for every iteration of keep factors visited by the calibration process in that round (not just the last iteration):
- the tallies of every candidate in that iteration.
- the keep factors of every candidate in that iteration.
- in the summary report of the election, publish two score dataframes, where the columns are rounds of the elections, and the rows are candidates ordered from strongest to weakest.
- in the first dataframe, indicate the convergent tally of each candidate in each round, assuming they were not eliminated;
- in the second dataframe, indicate the convergent keep factor of each candidate in each round, assuming they were not eliminated.